See every run and what it cost, on your own infrastructure.
Watch live status, replay any run step by step, and trace spend to the model route that caused it. A separate security-audit trail gives auditors a clean record. Everything runs on your own infrastructure.
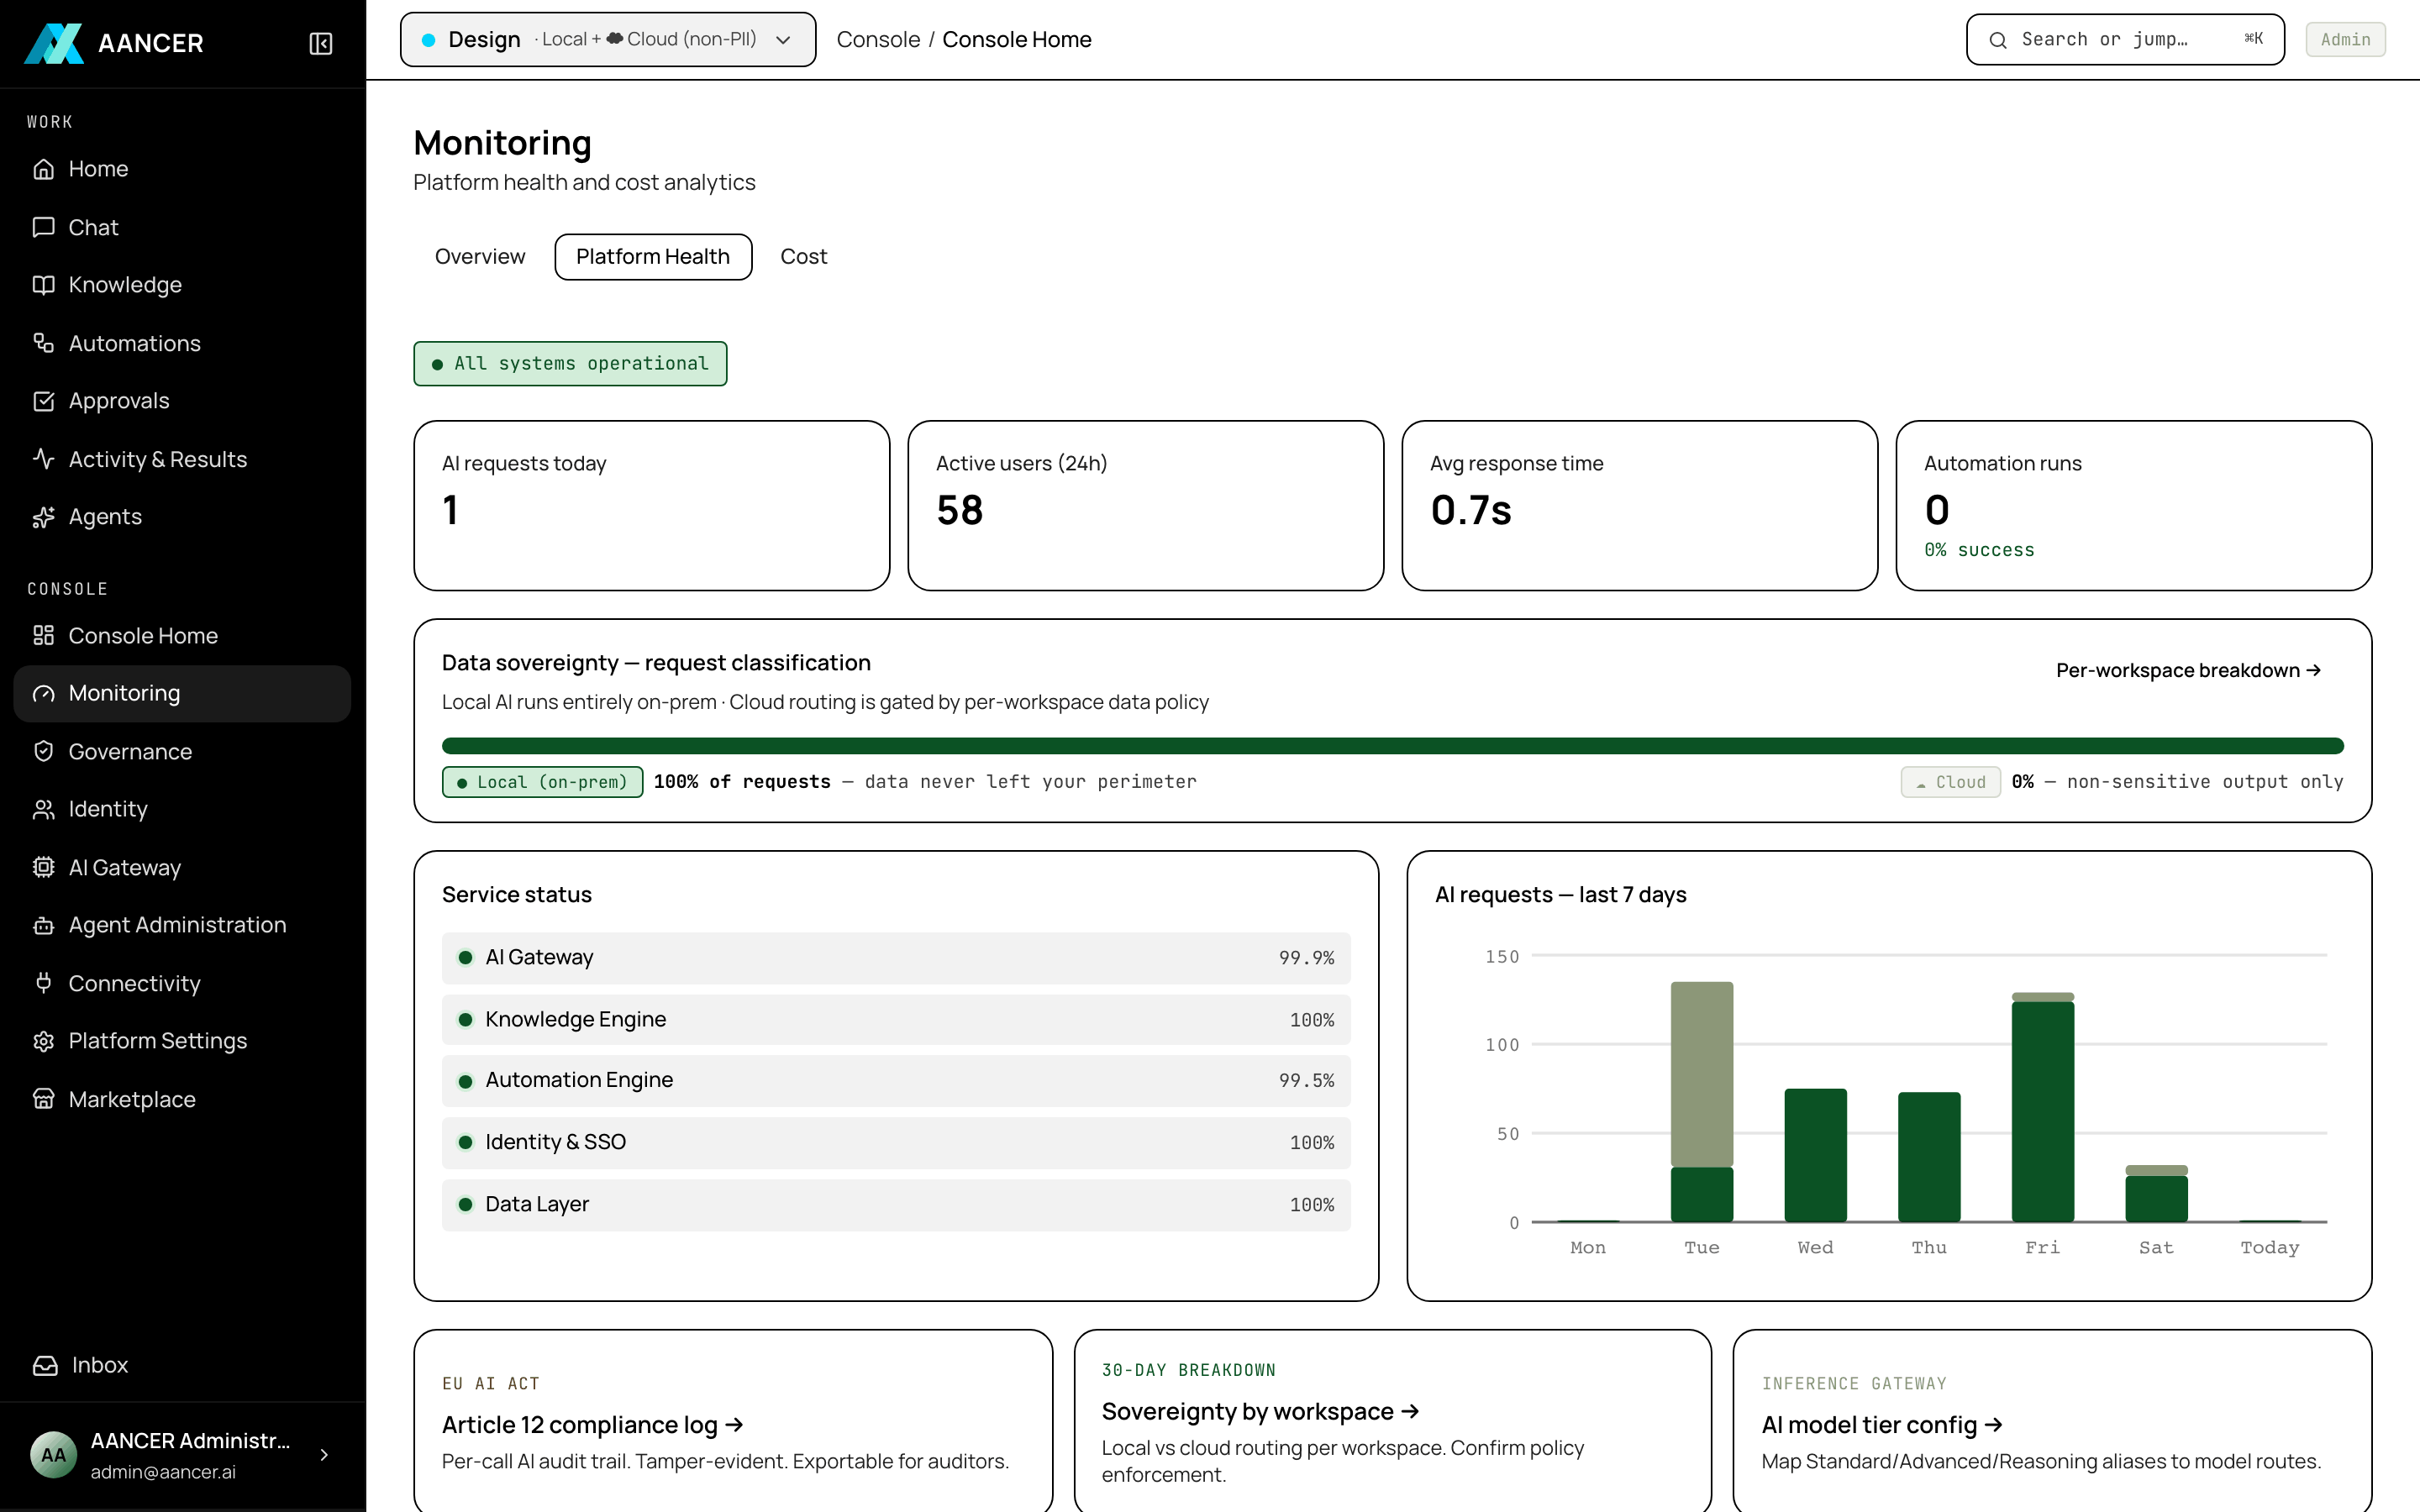
Every run leaves a record you can read.
Know what's actually running
Every status light reads from live runtime state, so what you see matches what is actually running.
Find why a run went wrong
Open any run and read every step, from loop iterations to raw errors, so you can see exactly what happened.
Know what each route costs
See what every call cost and which model route spent it.
Give auditors a clean record
Security events land in their own stream, separate from operational logs, so auditors read a single dedicated trail.
Clear decisions in one place
Every pending human approval waits in one inbox for review.
Nothing phones home
Default-deny egress keeps every metric on your infrastructure. No external telemetry leaves the box.
See the whole operational picture live.
Watch live runtime status, replay any run step by step, and trace spend to each model route. The security-audit trail stays separate, and everything runs on your own infrastructure.